k.e.w.l.
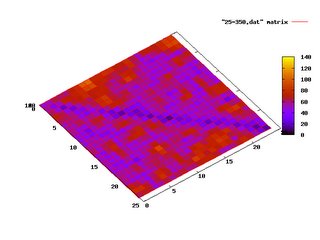
Gnuplot is yet another tool that fascinates me. In fact most of the small tools in Unix have fascinated me with their power - power to express, power to simplify. sed, grep, awk, vi, cscope, ctags, dd, dict are few that I use most or my favorites...and it _does_ simplify things to large extent. Recently wanted to plot a graph of a matrix. I under-estimated gnuplot and thought matlab would be better. It is good, but later I realized gnuplot is much simpler. And got the following in no time:

This graph is for a P2P project I'm working on. More red indicates more traffic. Intention of the project is to create a spanning tree / graph...so as to direct the traffic to most 'knowledgable' peer(s) known.
The other day, I had one of the most wonderfully spent 40 minutes while talking to Simon Crosby, CTO, Xensource. Being novice in the virtualization field with relatively meagre domain knowledge, I had to use more than my intuition to talk. But I felt I learnt a lot in the process, and most of all, it was inspiring.
kewl? wikipedia.

